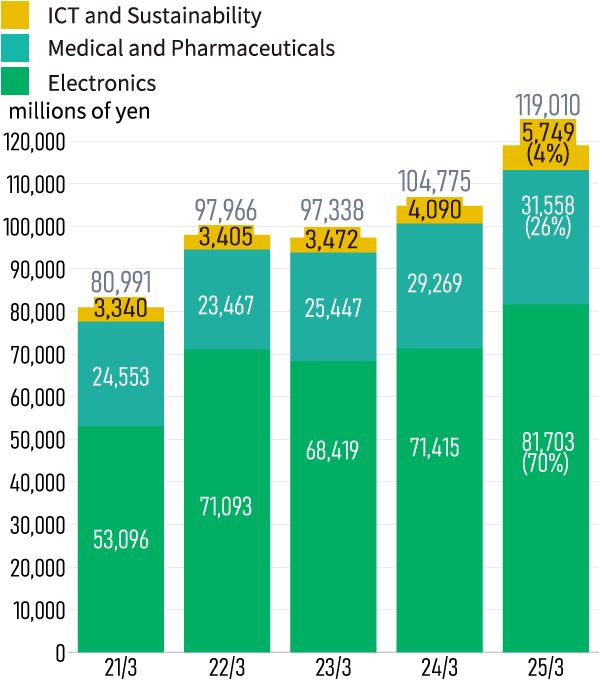
Sales
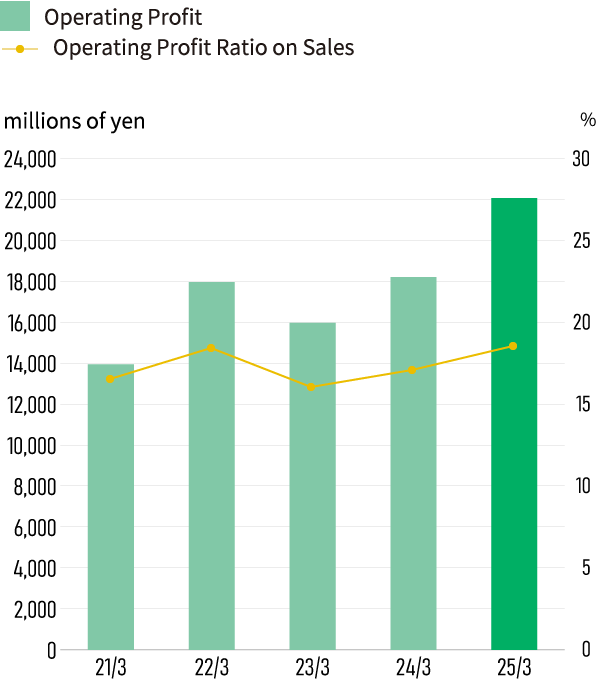
Operating Profit and Operating Profit Ratio on Sales
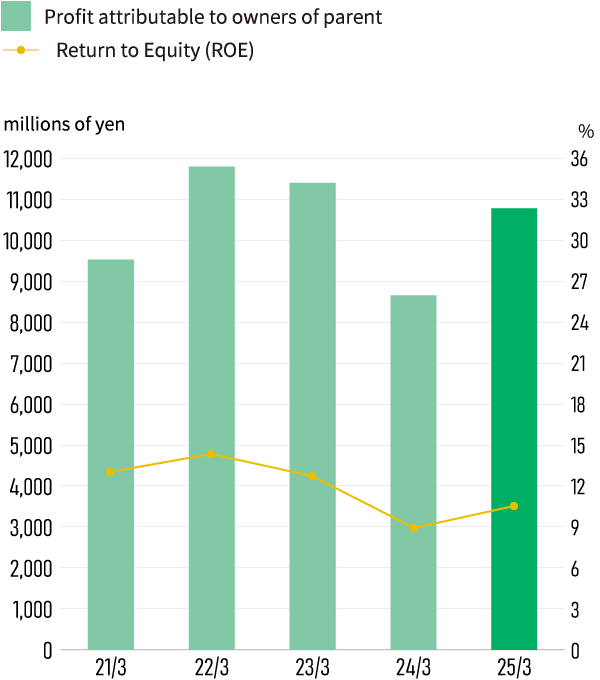
Profit attributable to owners of parent and Return on Equity
(Unit: millions of yen)
|
FY2022 |
FY2023 |
FY2024 |
FY2025 |
FY2026 |
|
|
Sales |
97,966 |
97,338 |
104,775 |
119,010 |
137,851 |
|
Electonics |
71,093 |
68,419 |
71,415 |
81,703 |
95,285 |
|
Medical and Pharmaceuticals |
23,467 |
25,447 |
29,269 |
31,558 |
36,490 |
|
ICT and Sustainability |
3,405 |
3,472 |
4,090 |
5,749 |
6,075 |
|
Operating Profit |
17,958 |
15,972 |
18,203 |
22,067 |
32,529 |
|
Profit attributable to owners of parent |
11,803 |
11,405 |
8,654 |
10,780 |
24,011 |
|
Operating Profit Ratio on Sales (%) |
18.3 |
16.4 |
17.4 |
18.5 |
23.6 |
|
Return on Equity (%) |
14.6 |
12.8 |
9.0 |
10.6 |
22.0 |
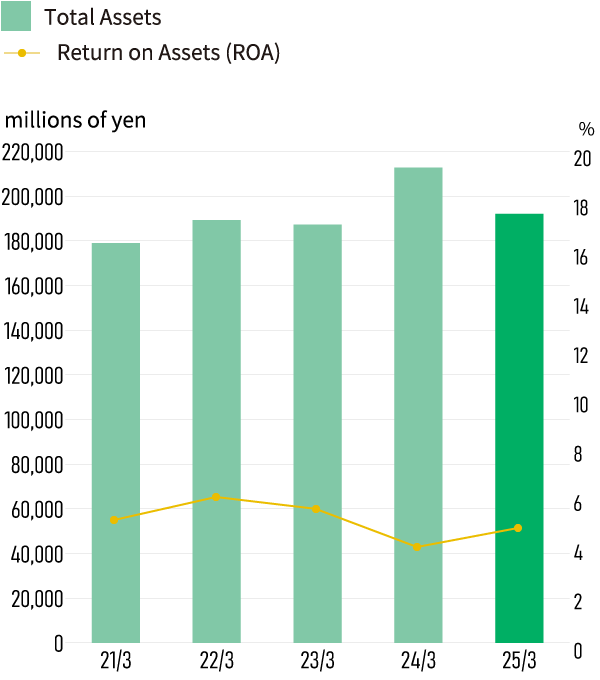
Total Assets and Return on Assets
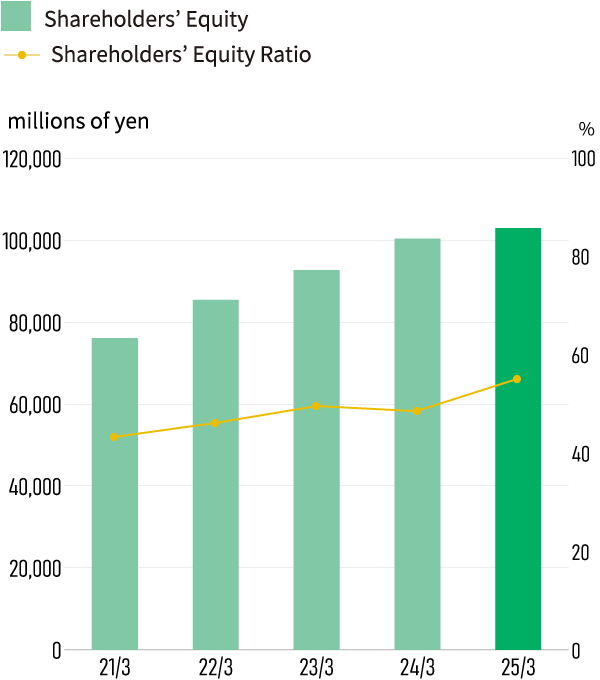
Shareholders' Equity and
Shareholders' Equity Ratio
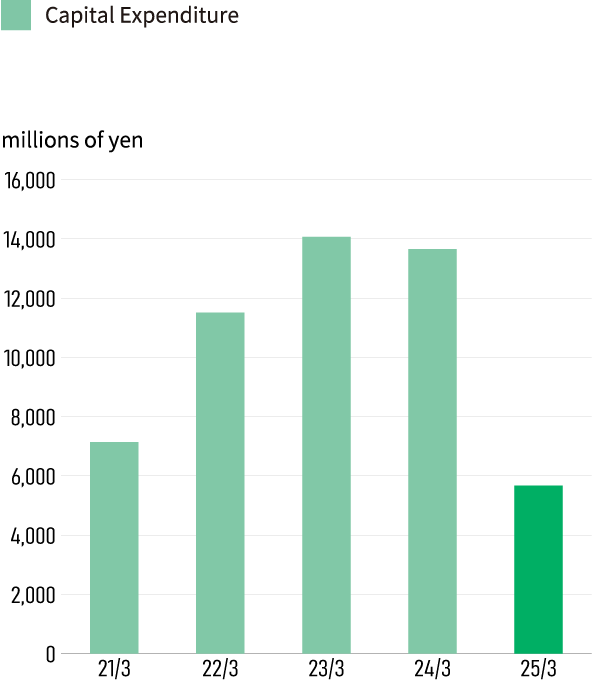
Capital Expenditure
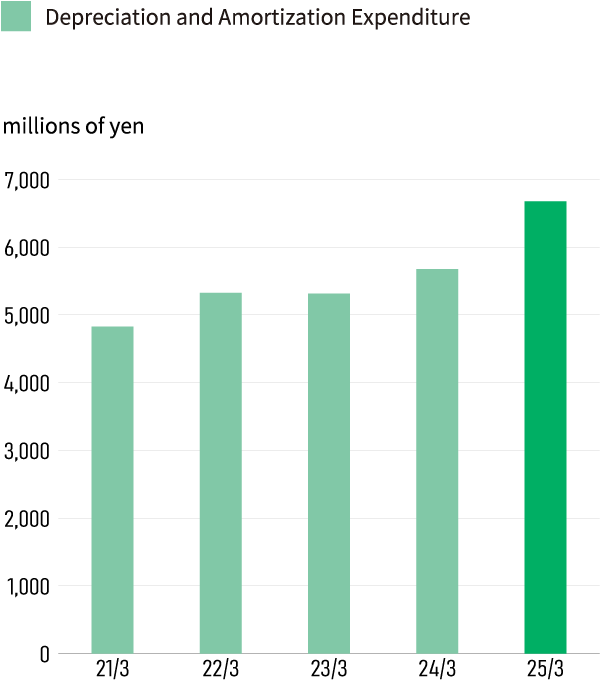
Depreciation and
Amortization Expenditure
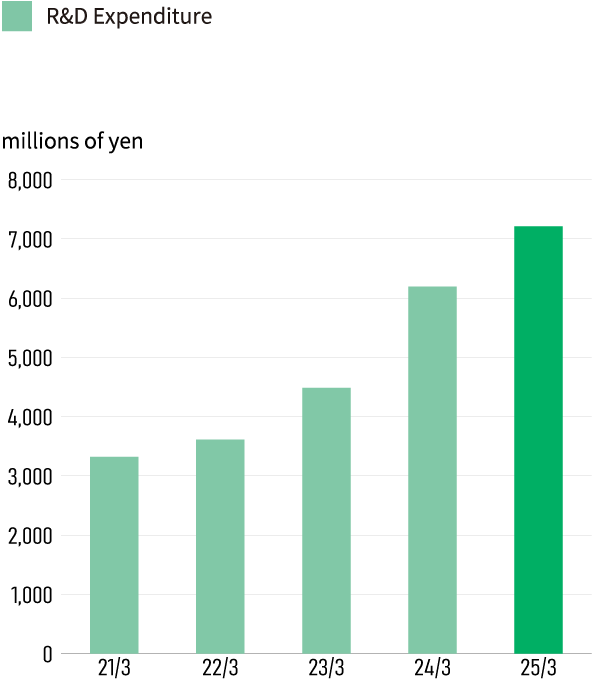
R&D Expenditure
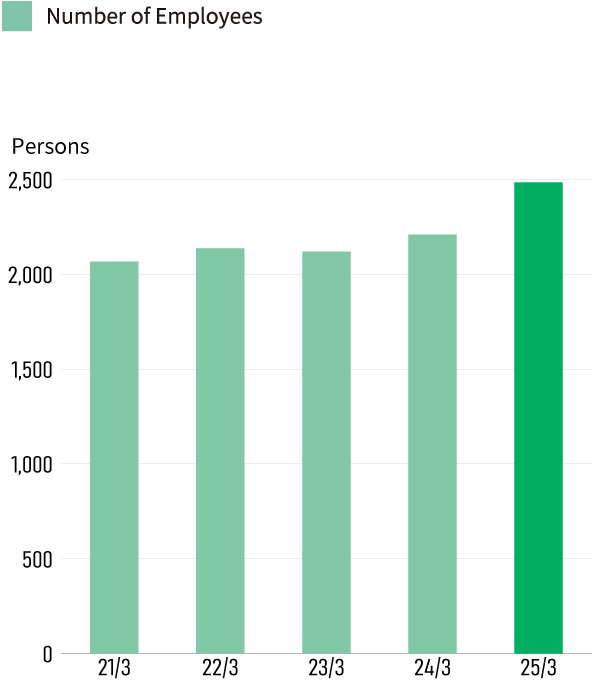
Number of Employees
(Unit: millions of yen)
|
FY2022 |
FY2023 |
FY2024 |
FY2025 |
FY2026 |
|
|
Total Assets |
189,273 |
187,263 |
212,751 |
192,022 |
201,928 |
|
Shareholders' Equity |
85,465 |
92,736 |
100,394 |
102,973 |
115,745 |
|
(※1)Capital Expenditure |
11,511 |
14,068 |
13,652 |
5,669 |
8,957 |
|
(※2)Depreciation and Amortization Expenditure |
5,328 |
5,317 |
5,679 |
6,680 |
7,168 |
|
R&D Expenditure |
3,611 |
4,483 |
6,194 |
7,211 |
7,637 |
|
(※3)Return on Assets (%) |
6.4 |
6.1 |
4.3 |
5.3 |
12.2 |
|
Shareholders' Equity Ratio (%) |
45.2 |
49.5 |
47.2 |
53.6 |
57.3 |
|
Number of Employees |
2,137 |
2,120 |
2,210 |
2,485 |
2,581 |
※1 Investment in property, plant and equipment and software
※2 Depreciation of property, plant and equipment and software
※3 Calculated from the average during the period