(Unit: millions of yen)
|
FY
2020 |
FY
2021 |
FY
2022 |
FY
2023 |
FY
2024 |
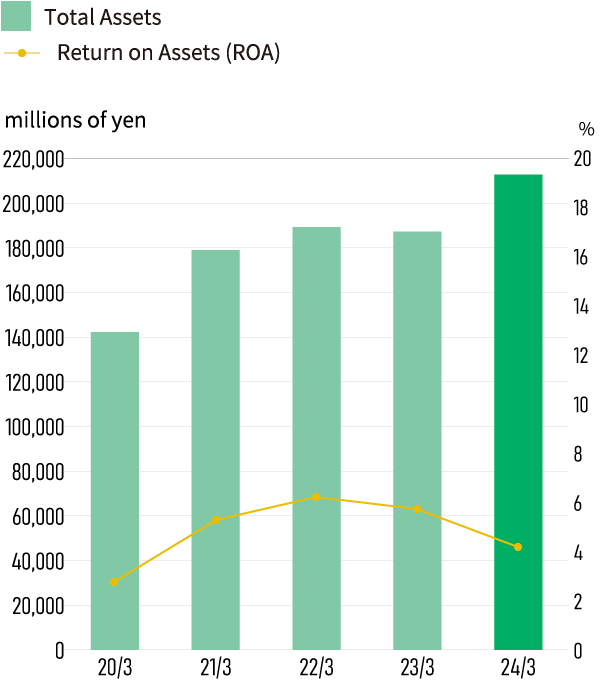
| Total Assets |
142,192 |
179,001 |
189,273 |
187,263 |
212,751 |
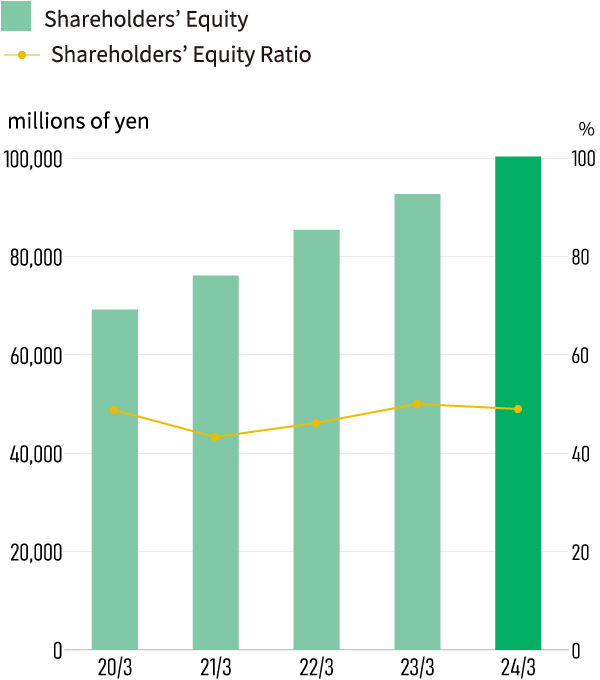
| Shareholders' Equity |
69,222 |
76,140 |
85,465 |
92,736 |
100,394 |
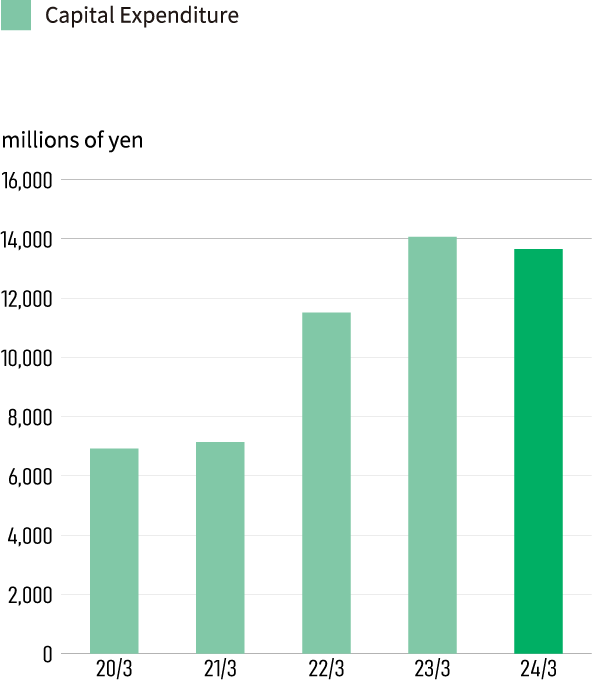
| (※1)Capital Expenditure |
6,916 |
7,141 |
11,511 |
14,068 |
13,652 |
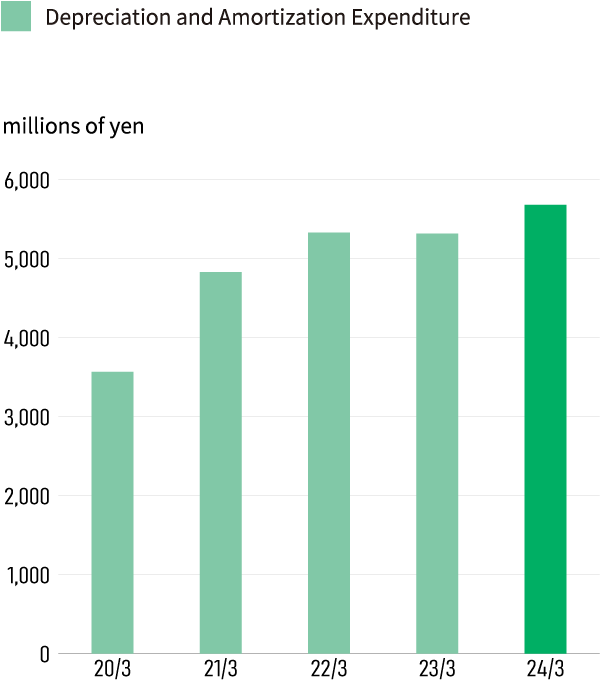
| (※2)Depreciation and Amortization Expenditure |
3,565 |
4,828 |
5,328 |
5,317 |
5,679 |
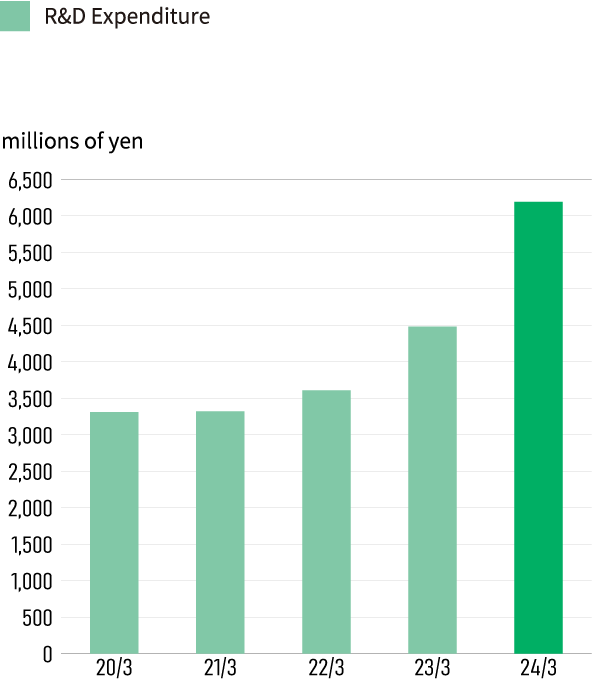
| R&D Expenditure |
3,312 |
3,321 |
3,611 |
4,483 |
6,194 |
| (※3)Return on Assets (%) |
3.0 |
5.9 |
6.4 |
6.1 |
4.3 |
| Shareholders' Equity Ratio (%) |
48.7 |
42.5 |
45.2 |
49.5 |
47.2 |
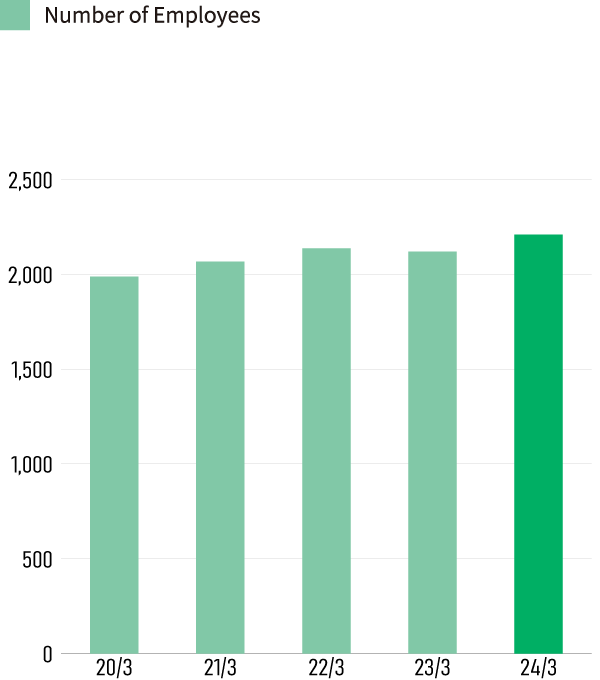
| Number of Employees |
1,988 |
2,067 |
2,137 |
2,120 |
2,210 |
※1 Investment in property, plant and equipment and software
※2 Depreciation of property, plant and equipment and software
※3 Calculated from the average during the period